The way I think about Diagnostic tools

Tue, March 13, 2012, 06:47 PM under Random | SoftwareProcess

Every software has issues, or as we like to call them "bugs". That is not a discussion point, just a mere fact. It follows that an important skill for developers is to be able to diagnose issues in their code. Of course we need to advance our tools and techniques so we can prevent bugs getting into the code (e.g. unit testing), but beyond designing great software, diagnosing bugs is an equally important skill.

To diagnose issues, the most important assets are good techniques, skill, experience, and maybe talent. What also helps is having good diagnostic tools and what helps further is knowing all the features that they offer and how to use them.

The following classification is how I like to think of diagnostics. Note that like with any attempt to bucketize anything, you run into overlapping areas and blurry lines. Nevertheless, I will continue sharing my generalizations ;-)

It is important to identify at the outset if you are dealing with a performance or a correctness issue.

  1. If you have a performance issue, use a profiler. I hear people saying "I am using the debugger to debug a performance issue", and that is fine, but do know that a dedicated profiler is the tool for that job. Just because you don't need them all the time and typically they cost more plus you are not as familiar with them as you are with the debugger, doesn't mean you shouldn't invest in one and instead try to exclusively use the wrong tool for the job. Visual Studio has a profiler and a concurrency visualizer (for profiling multi-threaded apps).
  2. If you have a correctness issue, then you have several options - that's next :-)

This is how I think of identifying a correctness issue

  1. Do you want a tool to find the issue for you at design time? The compiler is such a tool - it gives you an exact list of errors. Compilers now also offer warnings, which is their way of saying "this may be an error, but I am not smart enough to know for sure". There are also static analysis tools, which go a step further than the compiler in identifying issues in your code, sometimes with the aid of code annotations and other times just by pointing them at your raw source. An example is FxCop and much more in Visual Studio 11 Code Analysis.
  2. Do you want a tool to find the issue for you with code execution? Just like static tools, there are also dynamic analysis tools that instead of statically analyzing your code, they analyze what your code does dynamically at runtime. Whether you have to setup some unit tests to invoke your code at runtime, or have to manually run your app (and interact with it) under the tool, or have to use a script to execute your binary under the tool… that varies. The result is still a list of issues for you to address after the analysis is complete or a pause of the execution when the first issue is encountered. If a code path was not taken, no analysis for it will exist, obviously. An example is the GPU Race detection tool that I'll be talking about on the C++ AMP team blog. Another example is the MSR concurrency CHESS tool.
  3. Do you want you to find the issue at design time using a tool? Perform a code walkthrough on your own or with colleagues. There are code review tools that go beyond just diffing sources, and they help you with that aspect too. For example, there is a new one in Visual Studio 11 and searching with my favorite search engine yielded this article based on the Developer Preview.
  4. Do you want you to find the issue with code execution? Use a debugger - let’s break this down further next.

This is how I think of debugging:

  1. There is post mortem debugging. That means your code has executed and you did something in order to examine what happened during its execution. This can vary from manual printf and other tracing statements to trace events (e.g. ETW) to taking dumps. In all cases, you are left with some artifact that you examine after the fact (after code execution) to discern what took place hoping it will help you find the bug. Learn how to debug dump files in Visual Studio.
  2. There is live debugging. I will elaborate on this in a separate post, but this is where you inspect the state of your program during its execution, and try to find what the problem is. More from me in a separate post on live debugging.
  3. There is a hybrid of live plus post-mortem debugging. This is for example what tools like IntelliTrace offer.

If you are a tools vendor interested in the diagnostics space, it helps to understand where in the above classification your tool excels, where its primary strength is, so you can market it as such. Then it helps to see which of the other areas above your tool touches on, and how you can make it even better there. Finally, see what areas your tool doesn't help at all with, and evaluate whether it should or continue to stay clear. Even though the classification helps us think about this space, the reality is that the best tools are either extremely excellent in only one of this areas, or more often very good across a number of them. Another approach is to offer a toolset covering all areas, with appropriate integration and hand off points from one to the other.

Anyway, with that brain dump out of the way, in follow-up posts I will dive into live debugging, and specifically live debugging in Visual Studio - stay tuned if that interests you.


C++ AMP Video Overview

Fri, February 24, 2012, 03:44 PM under GPGPU | ParallelComputing

I hope to be recording some C++ AMP screencasts for channel9 soon (you'll find them through my regular screencasts link on the left), and in all of them I will assume you have watched this short interview overview of C++ AMP.

image 

Note: I think there were some technical problems with streaming so best to download the "High Quality WMV" or switch to progressive format.


Visual Studio 11 not 2011

Wed, February 8, 2012, 10:16 PM under VisualStudio

A little pet peeve of mine is when people incorrectly refer to the Developer Preview (or the upcoming Beta) as Visual Studio 2011 instead of the correct Visual Studio 11.

The "11" refers to the version number (internally we call it Dev11). What the product will be called when it is released is anyone's guess (it could keep the name or it could have a year appended to it, or it could be something else, who knows). Even if it does have a year appended to the name, I think it is a safe bet it won't be last year!

For reference, version 10 was the previous version of Visual Studio which happened to be released in 2010, hence it got the name Visual Studio 2010. That is what confuses new people to this product I guess... they think that the two-digit number matches the year, just because it coincided like that last year. (btw, internally we called it Dev10).

For further reference, older releases were: Visual Studio 2008 (v9) aka "Orcas", Visual Studio 2005 (v8) aka "Whidbey", Visual Studio .NET 2003 (v7.1) aka "Everett", and Visual Studio .NET 2002 (v7) aka "Rainier". Before that, we were in the pre-.NET era with Visual Studio 6 (where the version and the product name matched, without the year appended to the name).

So next time you hear someone saying "Visual Studio 2011", point them to this post for some mini-education... thanks.


C++ AMP open specification

Fri, February 3, 2012, 03:11 PM under ParallelComputing

Those of you interested in C++ AMP should know that I blog about that topic on our team blog.

Just now I posted (and encourage you to go read) our much awaited announcement about the publication of the C++ AMP open specification.

For those of you into compiling instead of reading, 3 days ago I posted a list of over a dozen C++ AMP samples.

To follow what I and others on my team write about C++ AMP, stay tuned on our RSS feed.


Best of "The Moth" 2011

Sun, January 1, 2012, 08:13 AM under Personal

Once again (like in 2004, 2005, 2006, 2007, 2008, 2009, 2010) the time has come to wish you a Happy New Year and to share my favorite posts from the year we just left behind.

1. My first blog entry in January and last one in December were both about my Windows Phone app: Translator by Moth and Translator by Moth v2. In between, I shared a few code snippets for Windows Phone development including a watermark textbox, a scroll helper, an RTL helper and a network connectivity helper - there will be more coming in 2012.

2. Efficiently using Microsoft Office products is the hallmark of an efficient Program Manager (and not only), and I'll continue sharing tips on this blog in that area. An example from last year is tracking changes in SharePoint-hosted Word document.

3. Half-way through last year I moved from managing the parallel debugger team to managing the C++ AMP team (both of them in Visual Studio 11). That means I had to deprioritize sharing content on VS parallel debugging features (I promise to do that in 2012), and it also meant that I wrote a lot about C++ AMP. You'll need a few cups of coffee to go through all of it, and most of the links were aggregated on this single highly recommended post: Give a session on C++ AMP – here is how

You can stay tuned for more by subscribing via one of the options on the left…


Translator by Moth v2

Fri, December 16, 2011, 10:10 PM under MobileAndEmbedded

If you are looking for the full manual for this Windows Phone app you can find it here: "Translator by Moth".

While the manual has no images (just text), in this post I will share images and if you like them, go get "Translator by Moth" from the Windows Phone marketplace.

open the app from the app list or through a pinned tile (including secondary tiles for specific translations)

Translator by Moth appList Translator by Moth tile 

language picker (~40 languages)

Translator by Moth from Translator by Moth to Translator by Moth to Translator by Moth to

"current" page

Translator by Moth current Translator by Moth sip Translator by Moth it Translator by Moth appBarTranslator by Moth CopyPaste

"saved" page

Translator by Moth savedEmpty Translator by Moth saved Translator by Moth saved_CM

"about" page

Translator by Moth about

Like? Go get Translator by Moth!


.NET access to the GPU for compute purposes

Thu, December 1, 2011, 07:42 PM under GPGPU | ParallelComputing

In the distant past I talked about GPGPU and Microsoft's then approach of DirectCompute. Since then of course we now have C++ AMP coming out with Visual Studio 11, so there is a mainstream easier way for developers to access the GPU for compute purposes, using C++.

The question occasionally arises of how can a .NET developer access the GPU for compute purposes from their C# (or VB) code. The answer is by interoping from the managed code to a native DLL and in the native DLL use C++ AMP.

As a long term .NET developer myself, I can tell you this is straightforward. Sure, there could have been a managed wrapper for C++ AMP, but honestly that is the reason we have interop – it doesn't make much sense to invest resources to solve a problem that is already solved (most developer customers would prefer investments in other areas of Visual Studio!). Besides, interoping from C# to C++ is much easier than interoping to some of the other older approaches of GPGPU programming ;-)

To help you get started with the interop approach, Igor Ostrovsky has previously shared the "Hello World" version of interoping from C# to C++ AMP in his blog post:

…we then were asked specifically about how to interop from C# to C++ AMP in a Metro style application on Windows 8, so Igor delivered again with this post:

Have fun!


Windows 8 Task Manager

Fri, November 4, 2011, 08:47 PM under Windows

If you are a user of Task Manager (btw, make sure you've read my Task Manager shortcut tips), you must read the blog post on the overhaul coming to Task Manager in Windows 8 – coo stuff!

Also, long time readers of my blog will know that back in 2008 I wrote about Windows Vista and Windows 7 number_of_cores support, and in 2009 I shared a widely borrowed screenshot of Task Manager from one of our 128-core machines. So I was excited to just read on the Windows 8 blog that Windows 8 will support up to 640 cores. They shared a screenshot of a 160-core machine, so there goes my record ;-)


Short interview on C++ AMP

Mon, October 17, 2011, 05:04 PM under GPGPU | ParallelComputing

While at the BUILD conference a month ago, I run into Bruno Boucard who asked me a few questions about C++ AMP. I just returned from vacation to find that he uploaded the 15-minute interview, so here is a direct link to youtube

play

http://www.youtube.com/watch?v=a2IbOe_ogGE

What DX level does my graphics card support? Does it go to 11?

Fri, October 14, 2011, 05:13 PM under GPGPU | ParallelComputing

Recently I run into a situation that I have run into quite a few times. Someone encounters a machine and the question arises: "Is there a DirectX 11 card in this machine?". Typically the reason you are interested in that is because cards with DirectX 11 drivers fully support DirectCompute (and by extension C++ AMP) for GPGPU programming. The driver specifically is WDDM (1.1 on Windows 7 and Windows 8 introduces WDDM 1.2 with cool new capabilities).

There are many ways for figuring out if you have a DirectX11 card, so here are the approaches that you can use, with a bonus right at the end of the post.

Run DxDiag

WindowsKey + R, type DxDiag and hit Enter. That is the DirectX diagnostic tool, which unfortunately, only tells you on the "System" tab what is the highest version of DirectX installed on your machine. So if it reports DirectX 11, that doesn't mean you have a DX11 driver! The "Display" tab has a promising "DDI version" label, but unfortunately that doesn't seem to be accurate on the machines I've tested it with (or I may be misinterpreting its use). Either way, this tool is not the one you want for this purpose, although it is good for telling you the WDDM version among other things.

Use the Microsoft hardware page

There is a Microsoft Windows 7 compatibility center, that lists all hardware (tip: use the advanced search) and you could try and locate your device there… good luck.

Use Wikipedia or the hardware vendor's website

Use the Wikipedia page for the vendor cards, for both nvidia and amd. Often this information will also be in the specifications for the cards on the IHV site, but is is nice that wikipedia has a single page per vendor that you can search etc. There is a column in the tables for API support where you can see the DirectX version.

Check if it is one of these recommended DX11 cards

You may not have a DirectX 11 card and are interested in purchasing one. While I am in no position to make recommendations, I will list here some cards from two big IHVs that we know are DirectX 11 capable.

  • Some AMD (aka ATI) cards
    • Low end, inexpensive DX11 hardware:
      • Radeon 5450, 5550, 6450, 6570
    • Mid range (decent perf, single precision):
      • Radeon 5750, 5770, 6770, 6790
    • High end (capable of double precision):
      • Radeon 5850, 5870, 6950, 6970
    • Single precision APUs:
      • AMD E-Series APUs
      • AMD A-Series APUs
  • Some NVIDIA cards
    • Low end, inexpensive DX11 hardware:
      • GeForce GT430, GT 440, GT520, GTS 450
      • Quadro 400, 600
    • Mid-range (decent perf, single precision):
      • GeForce GTX 460, GTX 550 Ti, GTX 560, GTX 560 Ti
      • Quadro 2000
    • High end (capable of double precision):
      • GeForce GTX 480, GTX 570, GTX 580, GTX 590, GTX 595
      • Quadro 4000, 5000, 6000
      • Tesla C2050, C2070, C2075

Get the DirectX SDK and run DirectX Caps Viewer

Download and install the June 2010 DirectX SDK. As part of that you now have the DirectX Capabilities Viewer utility (find it in your start menu by searching for "DirectX Caps Viewer", the filename is DXCapsViewer.exe). It will list all your devices (emulated, and real hardware ones) under the first node. Expand the hardware entries and then expand again the Direct3D 11 folder. If you see D3D_FEATURE_LEVEL_11_ under that, then your card supports feature level 11 which means it supports DirectCompute and C++ AMP. In the following screenshot of one of my old laptops, the card only goes to feature level 10.
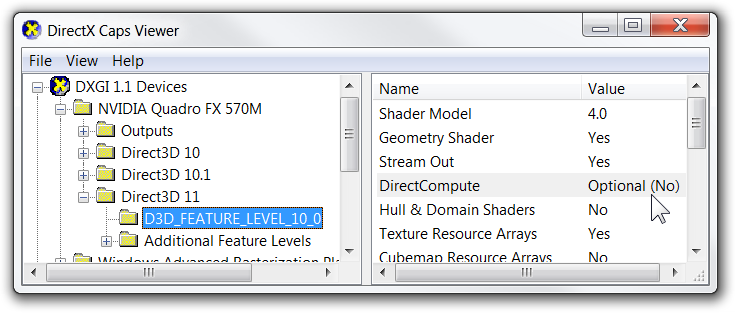
DirectX Caps Viewer

Run a utility from the web that just tells you!

Of course, writing some C++ AMP code that enumerates accelerators and lists the ones that are capable is trivial. However that requires that you have redistributed the runtime, so a more broadly applicable approach is to use the DX APIs directly to enumerate the DX11 capable cards. That is exactly what the development lead for C++ AMP has done and he describes and shares that utility at this post.