Thu, March 15, 2012, 07:05 PM under
VisualStudio
Every developer is familiar with hitting F5 and debugging their application, which starts their app with the Visual Studio debugger attached from the start (instead of attaching later). This is one way to achieve step 1 of the Live Debugging process.
Hitting F5, F11, Ctrl+F10 and the other ways to start the process under the debugger is covered in this MSDN "How To".
The way you configure the debugging experience, before you hit F5, is by selecting the "Project" and then the "Properties" menu (Alt+F7 on my keyboard bindings). Dependent on your project type there are different options, but if you browse to the Debug (or Debugging) node in the properties page you'll have a way to select local or remote machine debugging, what debug engines to use, command line arguments to use during debugging etc.
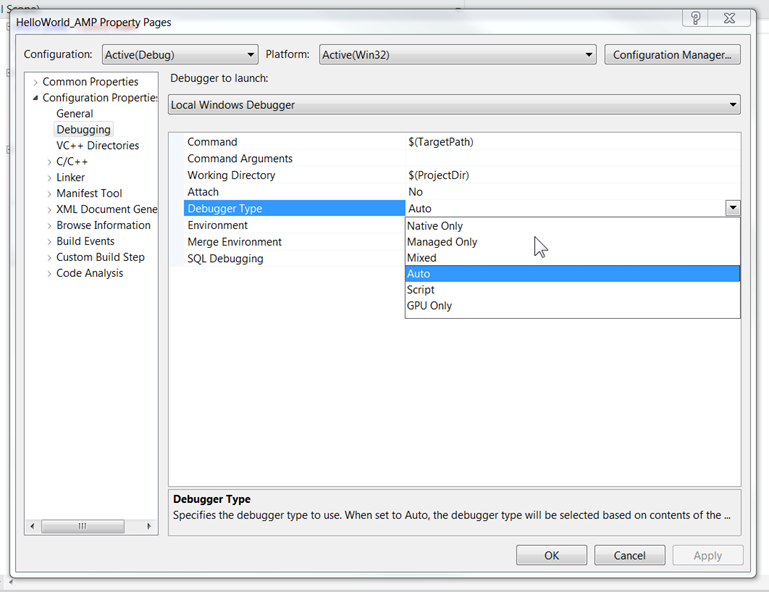
Currently the .NET and C++ project systems are different, but one would hope that one day they would be unified to use the same mechanism and UI (I don't work on that product team so I have no knowledge of whether that is a goal or if it will ever happen). Personally I like the C++ one better, here is what it looks like (and it is described on this MSDN page):

If you were following along in the "Attach to Process" blog post, the equivalent to the "Select Code Type" dialog is the "Debugger Type" dropdown: that is how you change the debug engine.
Some of the debugger properties options appear on the standard toolbar in VS. With Visual Studio 11, the Debug Type option has been added to the toolbar

If you don't see that in your installation, customize the toolbar to show it - VS 11 tends to be conservative in what you see by default, especially for the non-C++ Visual Studio profiles.